Features
CTGS program features
Survival analysis by genomic alterations
Survival analysis by gene quantities
Functional analysis by gene set
What is CTGS?
CTGS (Cancer Target Gene Screening) is a web application for cancer target screening using multi-omics data analysis. There are various subtypes of cancer, and each has different gene targets for therapeutic method or prognostic marker. CTGS help to find this target genes for specific subtypes or clinical features.
Multi-omics data have many layers of omics as follows,
- CNAs (Copy-number alterations)
- SNVs (Single nucleotide variations)
- RNA expressions
- DNA methylations
- Clinical information (etc. patient follow-up data)
Integrated analysis of multi-layers of omics data can help to find cancer target genes for specific groups. CTGS integrated various multi-omics datasets of breast cancer from cBioPortal or GEO. cBioPortal provides preprocessed multi-omics dataset including METABRIC and TCGA. The list of dataset is presented in Datasets page.
Differential gene quantities
Multi-omics data consists of patient-specific qualitative and quantitative information contained in varous omicslayers. CTGS provides the ability to visualize, compare, and correlate gene quantitative information at various levels in order to understand the association between clinical characteristics and differential gene quantities, such as copy-number values and gene expression levels.
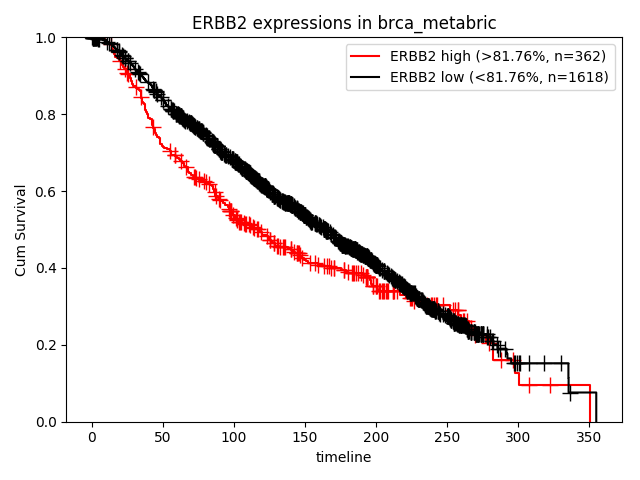
How about the difference of ERBB2 expression by subtype of breast cancer? In "Plots - Quantities" page in METABRIC dataset, the chart and result of statistics are presented."
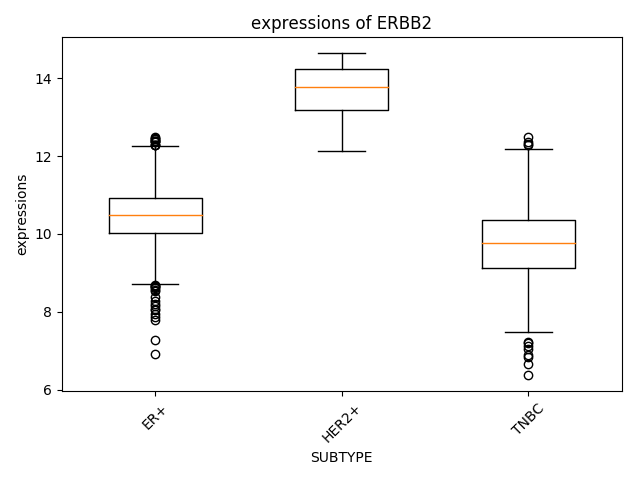
Researcher can use all categorical clinical features supplied by dataset. Result of Statistics is as follows,
- Basic statistics (count, mean, std, min, 25%, 50%, 75%, max)
- Student's t-test of all combination of features
- One-way ANOVA
Correlation analysis
Correlation analysis of gene quantities can be used to quantify the association of genes or omics layers. In order to confirm diverse correlations in multi-omics data, CTGS visualize it with scatter plot by specific subtypes or clinical features by setting gene and omics layer on X-axis and y-axis respectively.
How about the correlation of linear CNAs of ERBB2 and expression of GRB7 in HER2+ subtype? Ther result are presented in "Plots - Correlations" page.
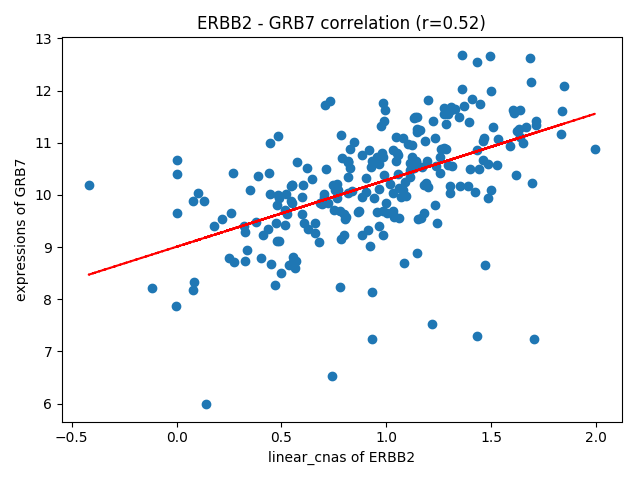
Researcher can select genes, omics level and subgroups. Result of Statistics is as follows,
- Pearson correlation
- Spearman correlation
- Kendall correlation
- Correlated gene list (r > 0.3)
- Reverse-correlated gene list (r > -0.3)
Survival analysis by genomic alterations
Clinical implication of genetic aberration for a particular gene can be confirmed by survival analysis. In order to confirm significant clinical implication by various genetic genetic aberrations, CTGS provides survival analysis using CNAs (amplification, homozygous deletion, gain and loss), SNVs, linear CNAs, gene expressions and DNA methylations.
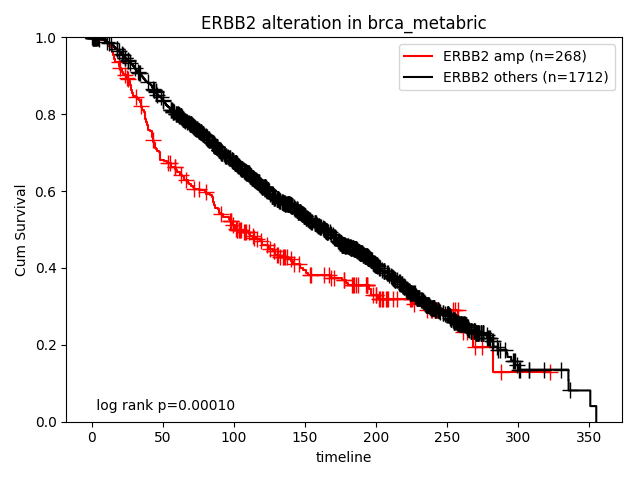
How about the clinical implication of amplification of ERBB2? Ther result are presented in "Survival analysis - Alterations" page.
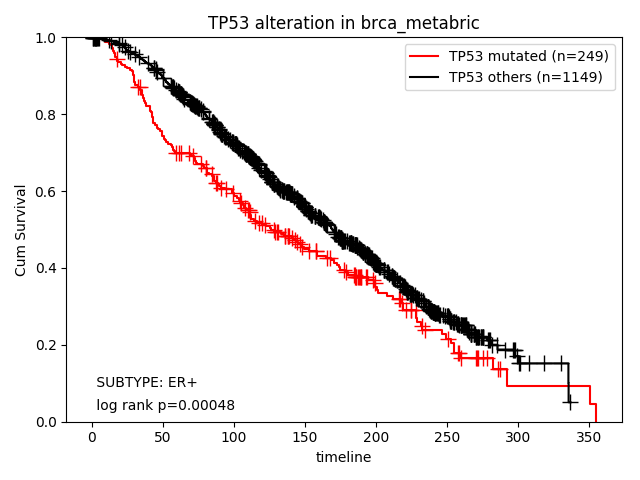
How about the clinical implication of mutation of TP53 in ER+ subtype? Ther result are presented in "Survival analysis - Alterations" page.
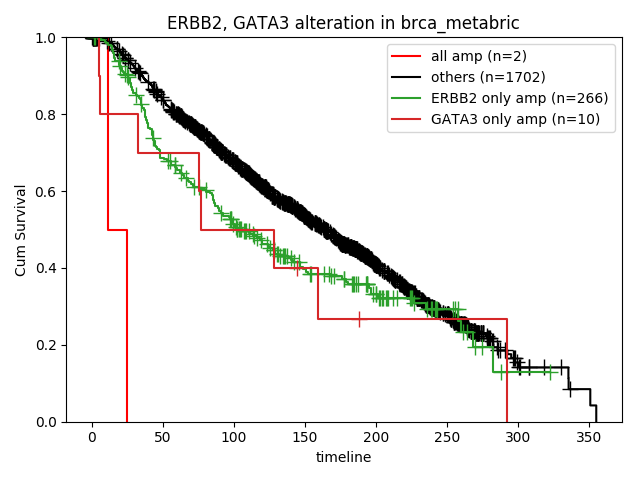
How about the clinical implication of amplification of ERBB2 and GATA3? Ther result are presented in "Survival analysis - Alterations" page.
Researcher can select genes, omics level and subgroups. Result of Statistics is as follows,
- Log-rank test
- Cox-proportional hazard regression for the groups
- Survival table
- Survival table (freq.)
Survival analysis by gene quantities
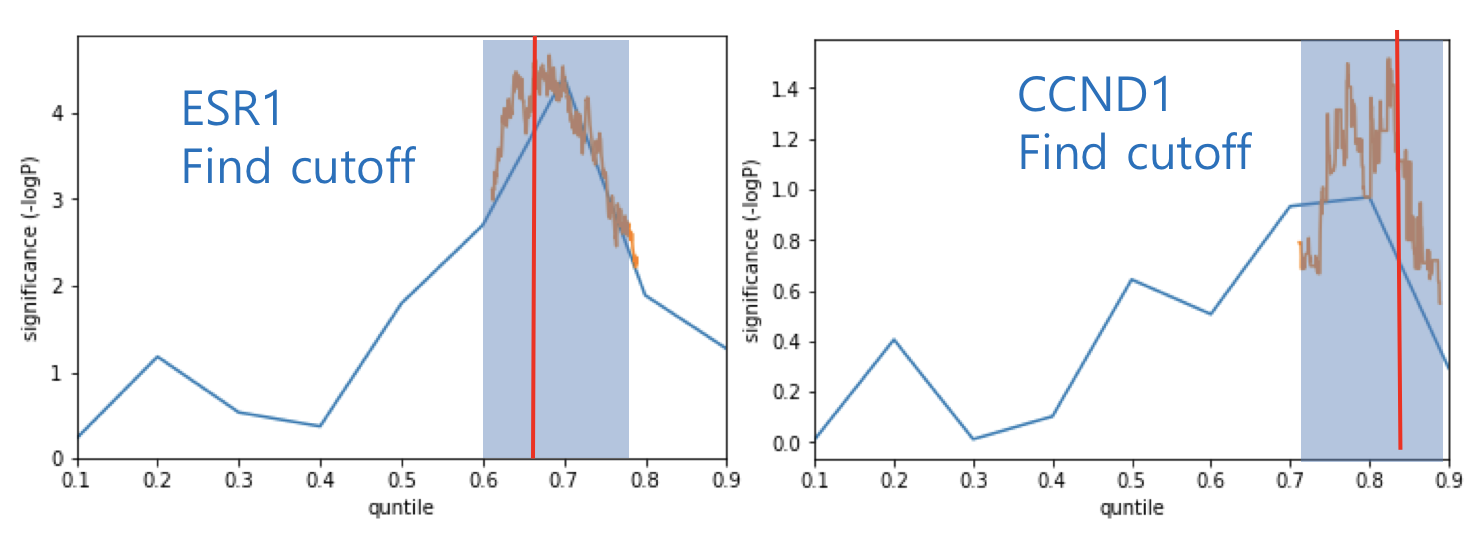
When performing survival analysis using gene quantities such as gene expression and DNA methylation, it is necessary to determine a cutoff point to stratify patients into two groups. There are various methods including median, quartile, fit of mixture model and significance of correlation with binary variable. When there is a survival variable, it has been reported that maximum survival significant cutoff is used. CTGS provides "Max-sig cutoff" option for survival analysis by gene quantities.
For massive survival analysis such as genome-wide screening, efficient two-step method was used. First step is finding significant region sparsely and second stop is finding most significant cutoff point in the region.
How about the clinical implication of expression of MYC? Ther result are presented in "Survival analysis - Quantities" page.
Researcher can select genes, omics level and subgroups. Result of Statistics is as follows,
- Log-rank test
- Cox-proportional hazard regression for quantities
- Cox-proportional hazard regression for the groups
- Survival table
- Survival table (freq.)
Functional analysis by gene set
Although almost gene-level survival analysis tools permits only single gene for query, but CTGS basically supported multiple genes. In order to identify biological functions associated with differential quantities, correlations, and clinical features, CTGS provides gene set to query instead of multiple genes. Researchers can select gene set by the function of "Or gene set" from MSIGDB. CTGS uses mean of quantities of these gene.
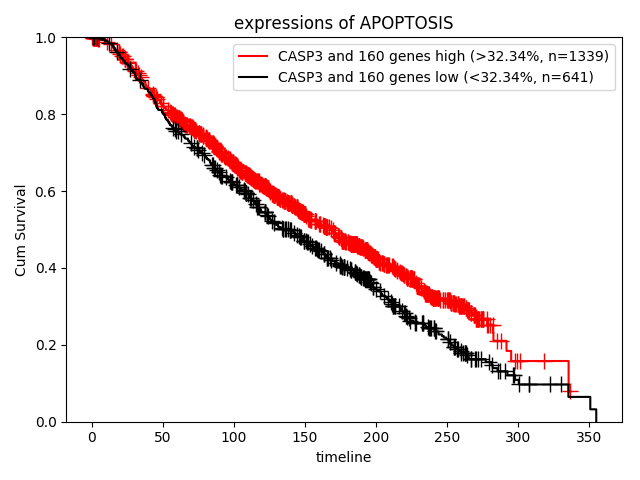
How about the clinical implication of expression of apoptosis? Ther result are presented in "Survival analysis - Quantities" page.
Target gene screening based on amplification
In order to nominate target genes considered clinical implication and alternative targets, CTGS provides significances by survival analysis of various genetic aberrations with ConSig-Amp in genome-wide level and present known drugs in TTD and SL (Synthetic lethal), SDL (Synthetic dosage lethal) partners in DAISY for specific subtypes or clinical features.
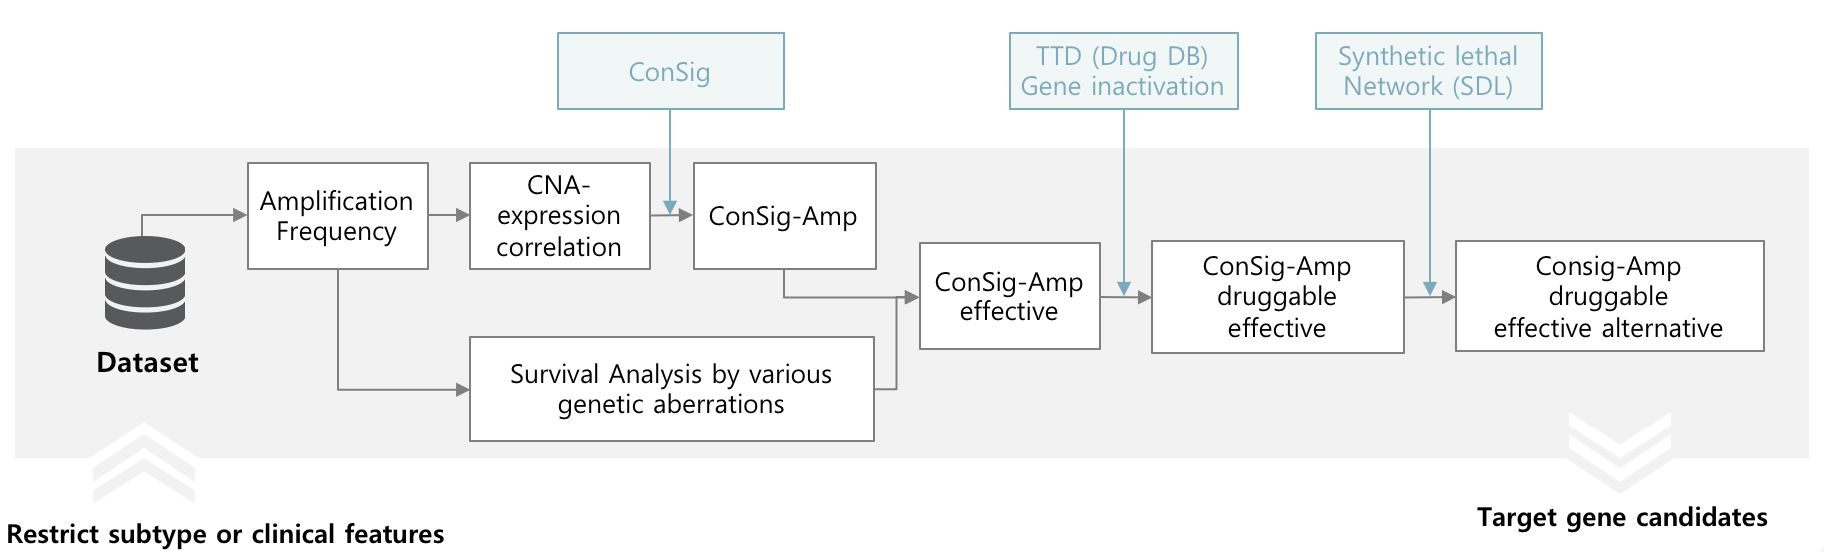
The result are presented in "Target gene screening - By amplification" page. Research can restrict minimum amplification frequency and number of top rank candidates and subtypes.
Target gene screening based on DNA methylation
DNA methylation is one of the important genetic aberrations that affect cancer progression. Hypo-methylation of oncogenes or hyper-methylation of tumor suppressors contribute to cancer progression. If a gene has high correlation between DNA methylation and expression in a specific subtypes or clinical features, it can be induced that it is a potential DNA methylation target gene.
CTGS designed ConSig-Met score, and it provides target gene screening based on DNA methylation by ConSig-Met.
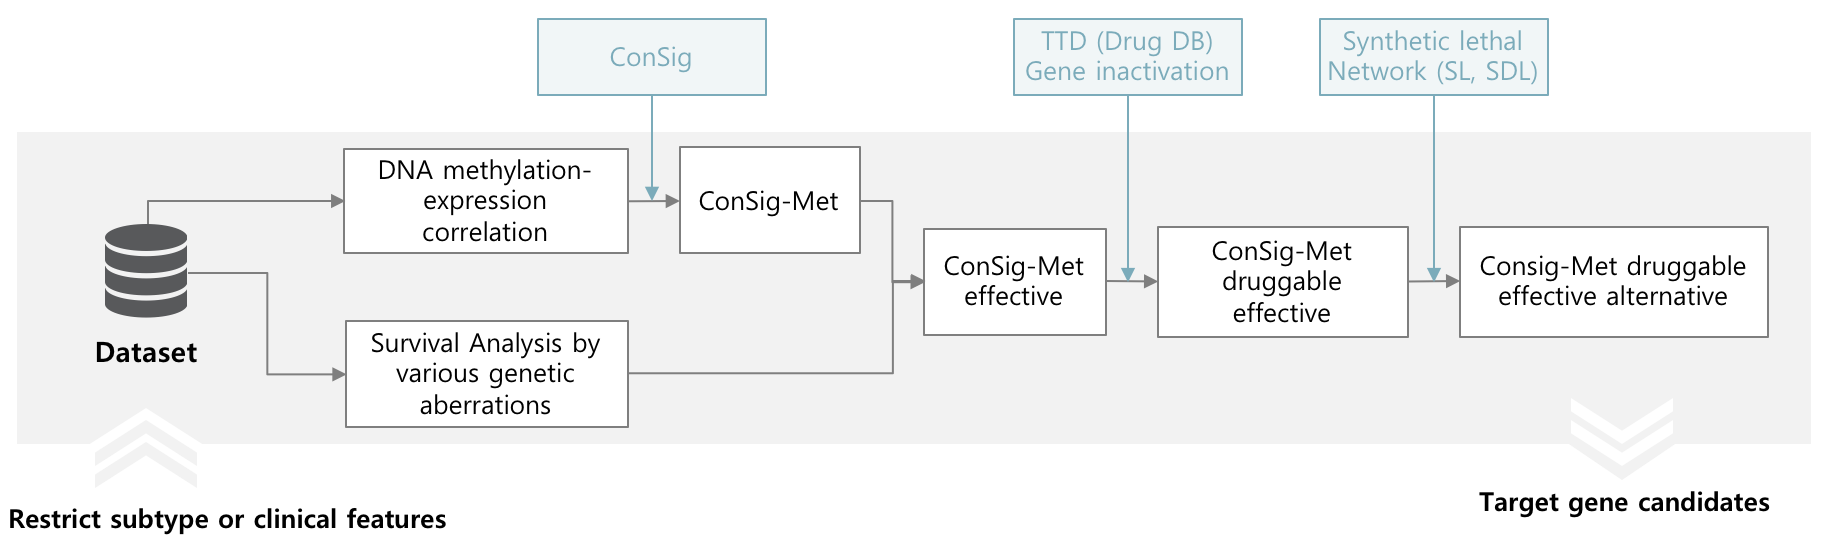
The result are presented in "Target gene screening - By DNA methylation" page. Research can restrict minimum amplification frequency and number of top rank candidates and subtypes.